
Cathodoluminescence and x-ray spectroscopy for pigment analysis
Introduction
In scanning electron microscopy (SEM), a tightly focused, high-energy electron beam is scanned across a sample while signals generated by interactions between the beam and specimen are recorded. By correlating these signals with the position of the electron beam, detailed images and compositional maps can be built (constructed) pixel-by-pixel.
Electron microscopy provides substantially higher spatial resolution than conventional optical imaging techniques. Beyond the significant gain in spatial resolution, the interaction of the electrons within materials allows us to identify the elemental composition and optical properties of individual pigment grains.
When a high-energy electron interacts with a material, some of its energy can be transferred and triggers optical transitions that subsequently result in the emission of light. This phenomenon is known as cathodoluminescence (CL) [1]. Measuring the intensity and wavelength of the emitted photons can reveal variations in composition, crystal structure, defects, and impurities because the underlying optical transitions are highly sensitive to the local environment.
High-energy electrons can also ionize atoms by ejecting inner-shell electrons. When an outer-shell electron fills the resulting vacancy, energy can be released as a characteristic x-ray. Because these x-ray energies are specific to the elements from which they originate, energy dispersive x-ray spectroscopy (EDS) can be used to identify the elemental composition of a specimen when elemental concentrations exceed the technique's detection limits.
With an appropriate experimental configuration, CL and EDS signals can be acquired simultaneously, providing complementary optical and elemental information. In this case, a Monarc® Pro CL system was combined with an EDAX® Octane Elite Super EDS detector mounted on a Zeiss Sigma VP microscope.
Pigment analysis
For the specific application of examining paint pigments, EDS and CL provide complementary information. Pigments with similar elemental compositions may be difficult to distinguish using EDS alone yet exhibit distinctly different CL images or spectra. Differences in atomic arrangement, defects, and impurities can influence a material's electronic structure, resulting in distinct optical transitions.
CL can also be sensitive to point defects or impurity concentrations far below the detection limit of EDS. On the other hand, some pigments may emit very little light while the EDS signal can remain strong. Combining CL and EDS therefore helps compensate for the limitations of either technique used independently, providing a more complete picture of complex pigment systems.
Fluorescent acrylic ink
The appearance of a typical paint or ink is primarily determined by how it absorbs and reflects visible light. Fluorescent materials behave differently: they absorb incident energy, but then subsequently re-emit part of that energy as light at characteristic wavelengths, producing their distinctive vivid appearance. In a SEM, the electron beam can similarly excite these materials, enabling their luminescence properties to be investigated at high spatial resolution using CL.
Data from some fluorescent acrylic inks are shown in Figure 1. In one sample, thousands of tiny spheres (~≈ 200 nm in diameter) emit intense orange luminescence. Rather than being individual inorganic pigment grains. These particles are polymer hosts containing optically active dyes.
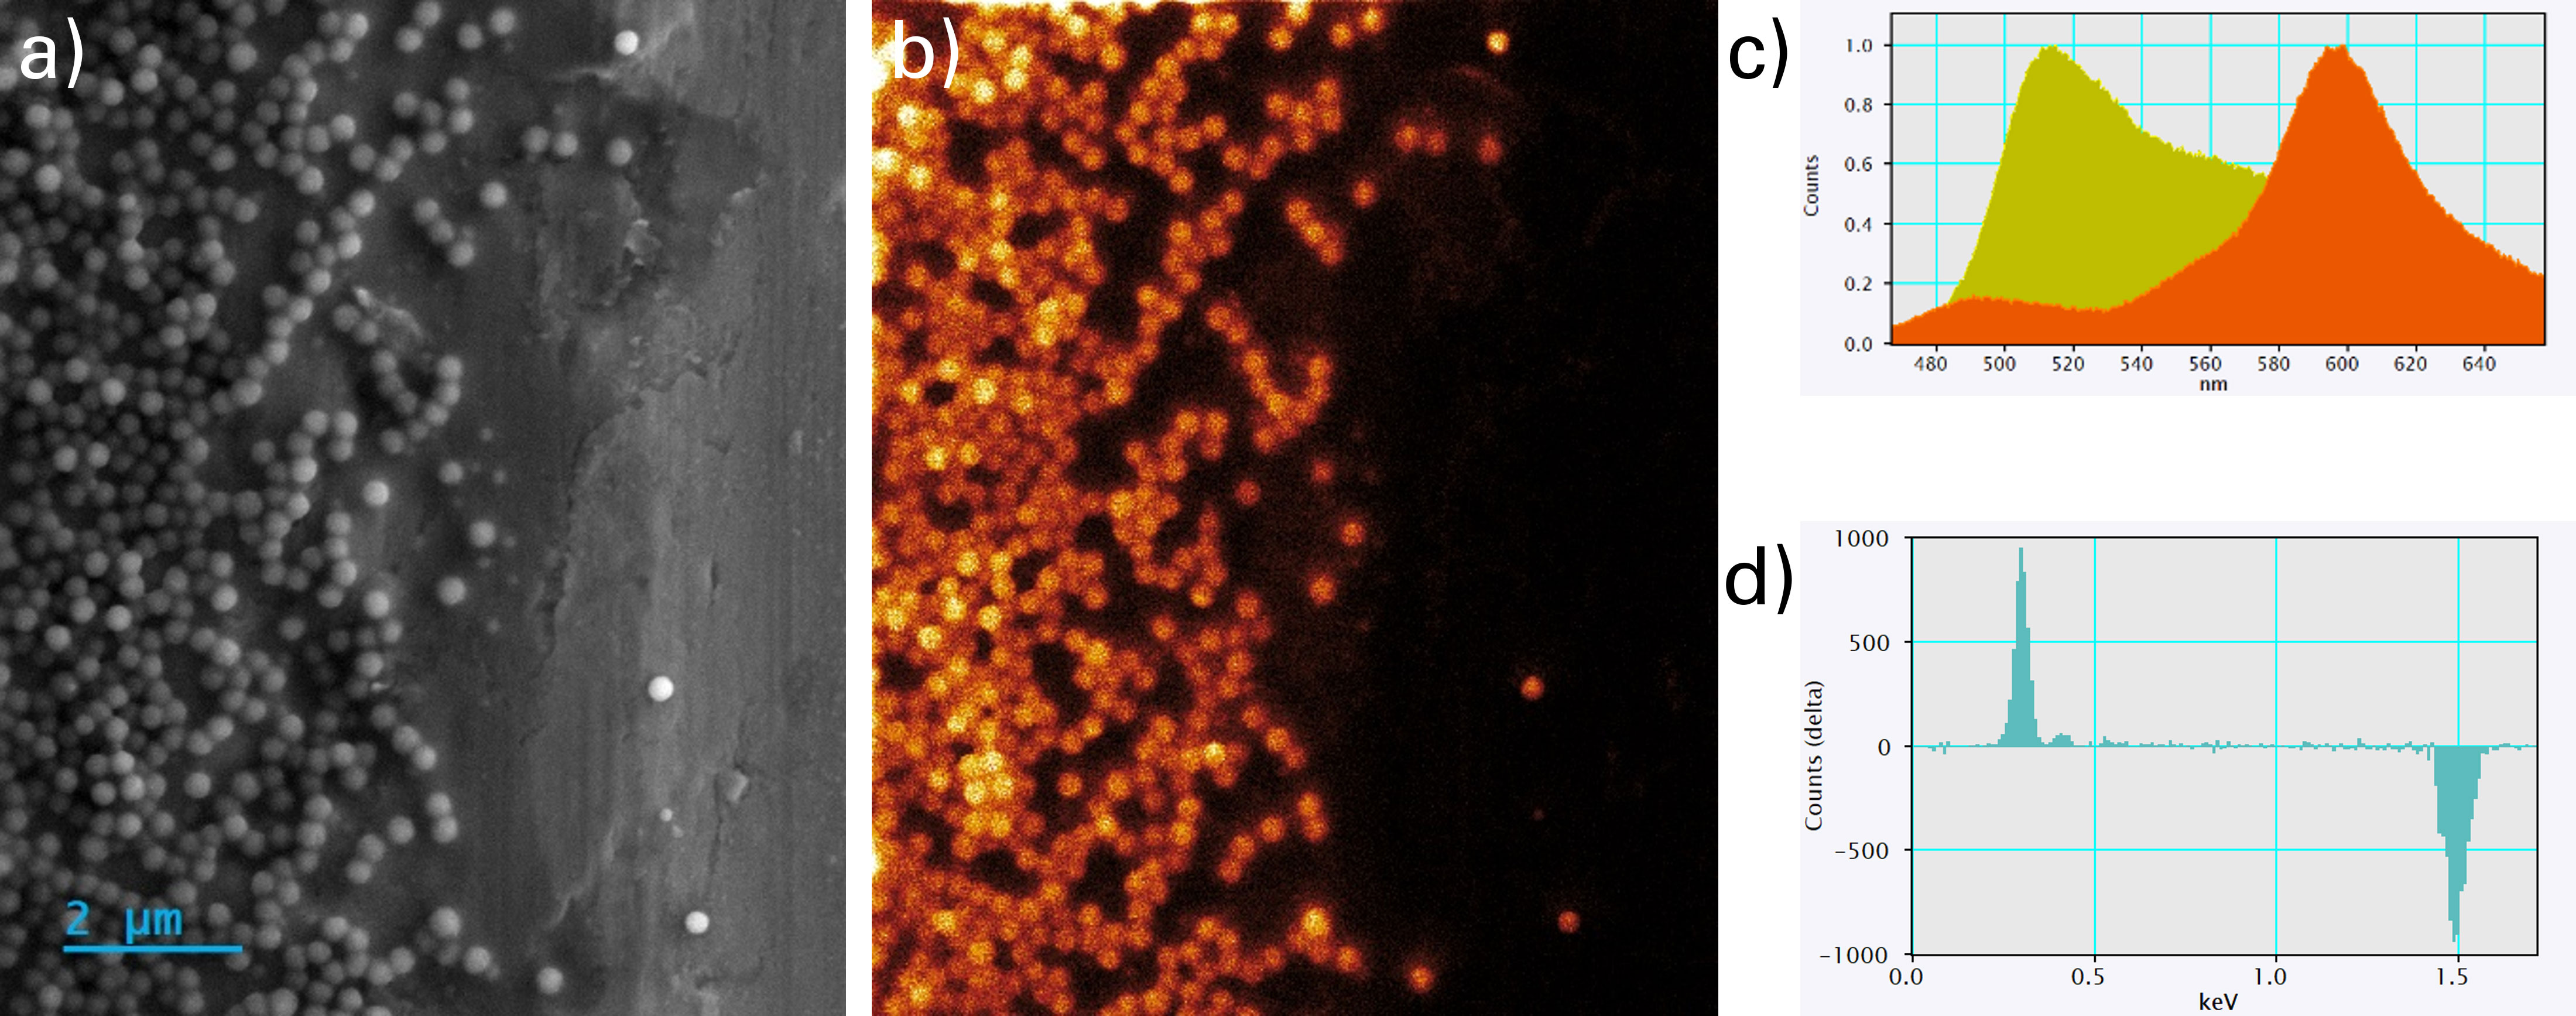
Figure 1. Experimental data from a fluorescent ink sample. a) Secondary electron image showing the morphology of the deposited ink. b) CL map showing intense light emission from the pseudo-pigment spheres, with some small signal from the binder on the substrate. c) CL spectra showing the wavelengths of the emitted light focused around 600 nm for orange ink and 515 nm for the yellow ink. d) EDS delta between spheres and the Al substrate, showing strong carbon signals associated with the polymer particles.
Although there are some naturally fluorescent minerals and compounds, many modern products rely on these manmade compounds to achieve high brightness. These “pseudo pigments” can be produced using several methods, including incorporating dyes into polymer particles. The tightly controlled manufacturing process can produce highly reliable optical properties, as demonstrated by the consistent emission wavelengths between spheres.
Fluorescent inks can produce vivid colors, but their lightfastness may be limited. Over time, exposure to daylight (particularly ultraviolet radiation) can degrade dye molecules and reduce their luminescence. Similar degradation can occur during electron microscopy due to interactions with the high energy electron beam damaging the dyes, reducing luminescence intensity over time.
A yellow, fluorescent ink was also measured and found to display a distinct CL spectrum peaking around 515 nm. However, with EDS, the yellow and orange samples appear similar, with carbon being the predominant signal detected from the polymer spheres. This is because the molecular differences responsible for their different colors cannot readily be distinguished by EDS alone.
This provides a clear example of the complementary value of CL. Although the two materials have similar elemental signatures, their distinctly different luminescence spectra allow them to be readily differentiated.
Ice yellow acrylic paint
A more traditional “ice yellow” acrylic paint sample shows a distribution and mix of pigments in binder. Unlike the fluorescent inks described above, this paint contains a mixture of pigment species that collectively produce the desired color and opacity.
EDS elemental mapping can be used to rapidly distinguish different pigments within the mixture. Local EDS spectra can then provide additional compositional information to help identify the compounds present.
For example, the largest pigment grains were identified as TiO2, which is one of the most common white pigments (titanium white). Interestingly, TiO2 can also exhibit luminescence, producing a broad CL spectrum. Variations in its luminescence behavior can provide additional information about impurities and other characteristics that may be useful in forensic or conservation studies of pigments from different sources. Other pigments found in this paint include iron oxide (yellow), calcite, and more.
Several smaller, luminescent inclusions are also visible, highlighted by the orange arrows in Figure 2d. CL readily reveals these approximately 100 nm fluorescent particles despite their sparse distribution throughout the paint. Their presence may contribute to the overall optical appearance of the formulation.
Compared with the fluorescent particles observed in the orange ink, these particles exhibited greater stability under electron-beam exposure. This likely corresponds to an improved lightfastness. Multiple emission profiles were measured from different particles indicating multiple types are present.
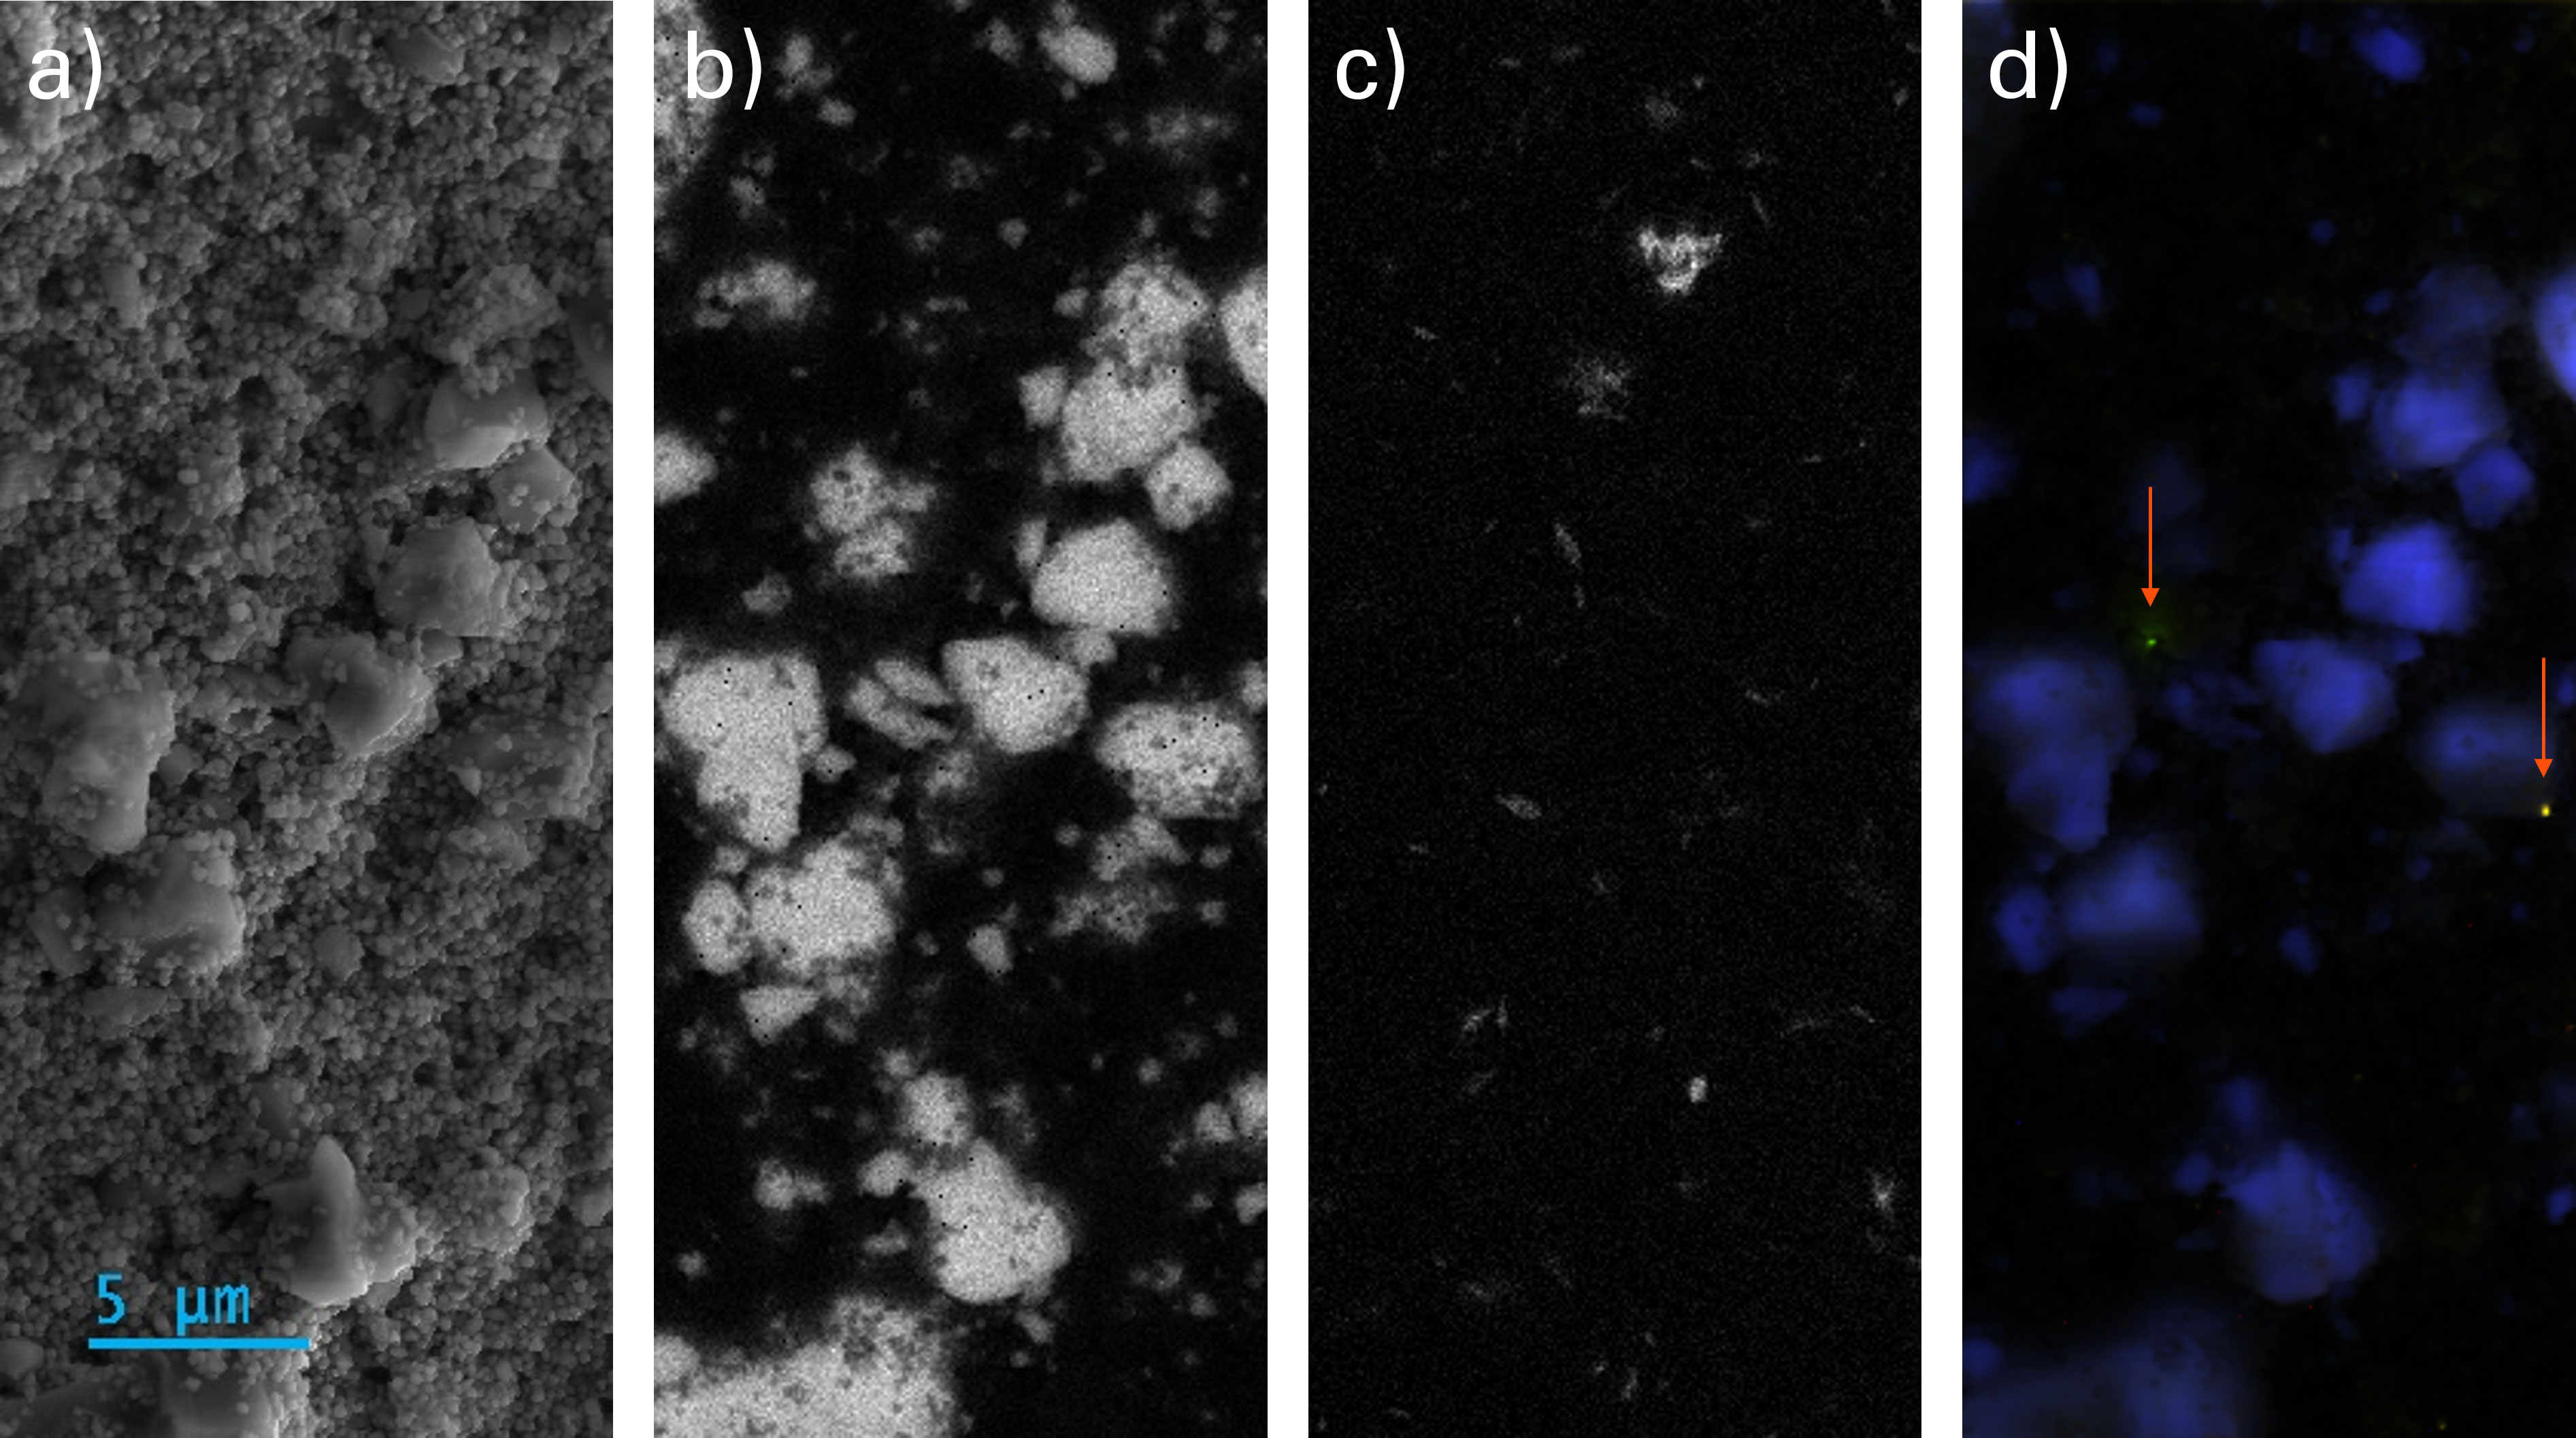
Figure 2. SEM analysis of ice yellow acrylic paint. a) Secondary electron image showing surface morphology, b) a Ti elemental map, c) an iron map, and d) a composite CL image showing the calcite peak in blue and two fluorescent particles in green and red.
Conclusion
The high spatial resolution of SEM enables individual pigment particles to be resolved and analyzed within complex paint formulations. EDS provides elemental information that can identify and differentiate many pigment species. In the case of the fluorescent dye compounds, the elemental composition can be extremely similar or even identical, but the arrangement of the atoms in the structure can differ. This results in indistinguishable EDS spectra but unique electronic structures that can be probed with CL.
In some more conventional pigments, impurity concentrations below the detection limit of EDS can influence the optical emission, allowing for potential sources of the materials to be identified. This can provide a useful tool for forensic or conservation studies.
By acquiring CL and EDS together, researchers can correlate optical and elemental information from individual particles at the nanoscale, providing a more comprehensive approach to pigment characterization than either technique can offer independently.
References
- Palamara, E., Das, P.P., Nicolopoulos, S. et al. “Towards building a Cathodoluminescence (CL) database for pigments: characterization of white pigments”, Herit Sci 9, 100 (2021), https://doi.org/10.1186/s40494-021-00575-4
- Georg Koschek, “Combined cathodoluminescence and X-ray analysis of paint pigments”, Journal of Microscopy 168, no. 1 (1992): 79-84, https://doi.org/10.1111/j.1365-2818.1992.tb03252.x
- Stoecklein, W. and Göbel, R. "Application of Cathodoluminescence in Paint Analysis," Scanning Microscopy: Vol. 6: No. 3, Article 4 (1992), Application of Cathodoluminescence in Paint Analysis