
Image segmentation for enhancing spectrum image analysis
Introduction
A spectrum image (SI) is a multidimensional dataset represented as a two-dimensional image, in which each pixel contains an associated one-dimensional spectrum. These spectra may include cathodoluminescence (CL), electron energy loss spectroscopy (EELS), or x-ray spectroscopy data. Despite their different physical origins, their shared data structure enables analyses using similar tools.
DigitalMicrograph® already includes built in tools for tasks, such as peak fitting, deconvolution, denoising, and region-of-interest (ROI) analysis. Its scripting interface further extends these capabilities, enabling users to write custom routines or integrate external libraries for more advanced or specialized analyses.
Segmentation
Spectrum images frequently contain multiple distinct regions of interest. While users can manually define ROIs to compare spectral characteristics, these regions are often numerous or irregularly shaped, making the process laborious and inefficient.
Image segmentation provides a more efficient approach to automatically define and separate features into discrete regions for subsequent analysis. Segmentation can be performed using classical image-processing techniques or more advanced machine learning-based approaches. Owing to its widespread use, several established Python libraries are available to support segmentation workflows, including scikit-image, OpenCV, NumPy, and SciPy.
Once features have been segmented, the resulting object map provides a foundation for automated spectrum analysis. Spectra associated with individual objects can be extracted to rapidly calculate statistical measurements or combined to produce summed spectra with improved signal-to-noise ratio. Objects can also be classified according to their spectral characteristics, extending the workflow to semantic labeling. In addition, spectral variation within individual objects can be evaluated to investigate their homogeneity.
Using the Python API within DigitalMicrograph enables these customized analyses while allowing users to continue exploring the resulting data through the familiar DigitalMicrograph interface.
Examples
The first example presents energy dispersive x-ray spectroscopy (EDS) data from battery catalyst particles. Individual particles are identified through segmentation, and the mean spectrum from each object is calculated to produce a stack of representative spectra for classification. Based on their spectral characteristics, the particles can then be separated into two categories (Figures 1a and 1b).
The second example analyzes a microLED array. After individual devices are segmented, the mean centroid energy is calculated for each device. The resulting distribution shows how many devices emit at each energy, providing a direct way to evaluate uniformity across the array. Variations in emission energy may reflect differences in material composition or epitaxial layer thickness (Figures 1c and 1d). The same object-based approach can also be used to examine spectral variation within individual devices.
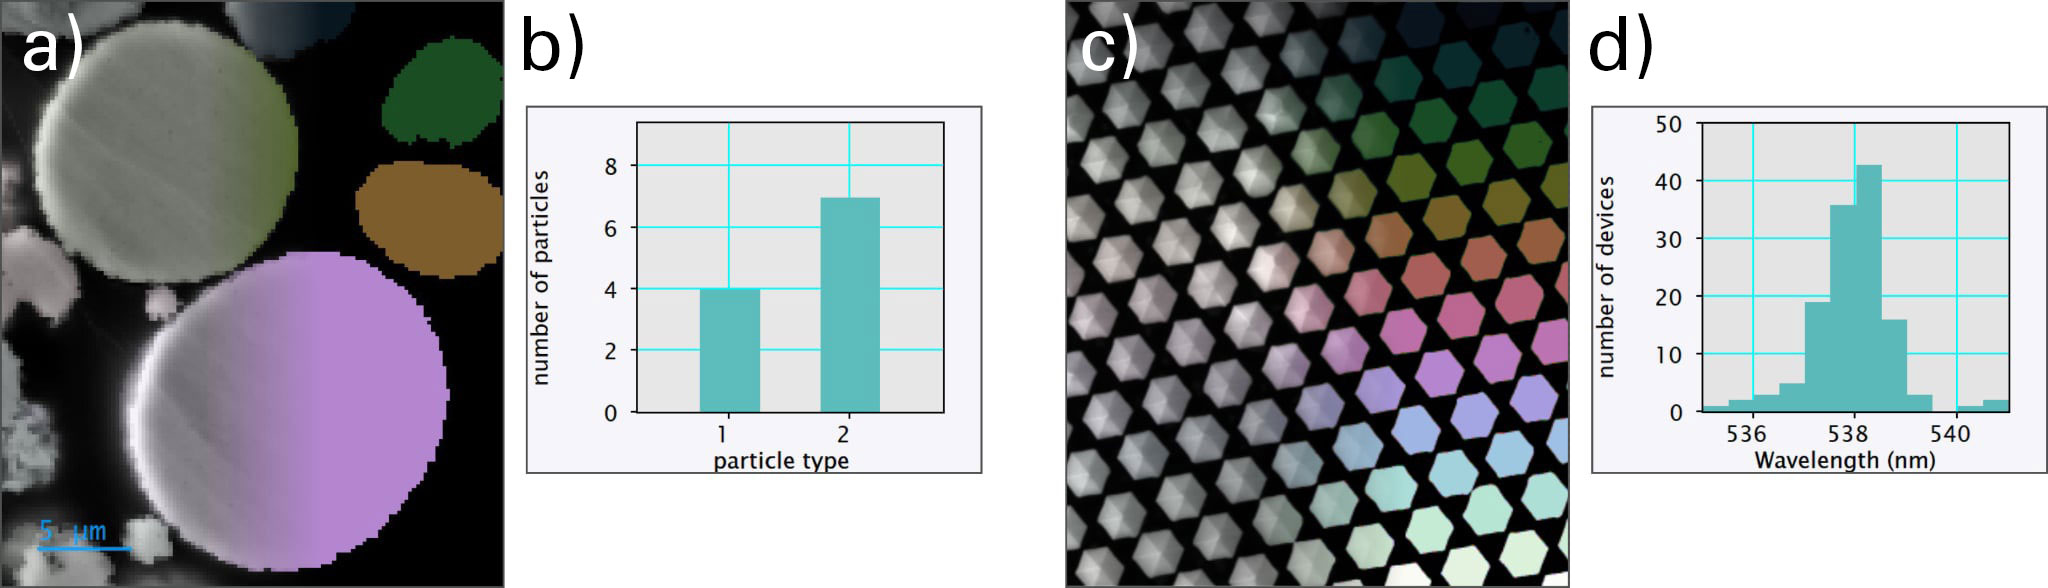
Figure 1. a) Secondary electron image of particles within battery material with segmented features overlaid. b) Statistical results obtained from semantic classification of the segmented particles. c) Secondary electron image of a device array with segmented features overlaid. d) The distribution of emission energies measured across the devices.
Conclusion
Image segmentation provides a powerful approach for extending spectrum image analysis in DigitalMicrograph. By automatically identifying individual features and associating them with their corresponding spectra, segmentation enables statistical analysis to be performed across large and complex datasets more efficiently.
High-dimensional data can be reduced to meaningful statistical distributions, classifications, or figures of merit while retaining the ability to investigate individual objects and spectra. By combining image segmentation, spectrum analysis, and automation, researchers can extract quantitative information more efficiently and consistently, helping accelerate materials characterization and process development.